Distributed Tracing in .NET - Part 1 - Setup Open Telemetry
In the previous post we described a sample application and the goals of the exploration into distributed tracing. In this post I want to configure the application to export data using Open Telemetry.
What is Open Telemetry?
OpenTelemetry is an open-source observability framework for collecting data about how software runs (metrics, logs, traces). It provides a standard (vendor-agnostic) way to instrument different programming languages so that this data can be easily analyzed by monitoring platforms.
The ‘standard’ way that I have been recording structured logs in my .NET applications is by adding log entries (via the ILogger interface) and recording the logs in a SQL Server database table. OpenTelemetry provides a toolkit to export the same log entries using a standard protocol, which can be ingested by any log analysis tool, like Seq (https://datalust.co/seq), or Azure Application Insights.
Run Seq Locally
For experimenting with distributed tracing, I will be running Seq locally. Here is the docker-compose.yml file I am using to run it using Docker:
version: '3.8'
services:
  seq:
    image: datalust/seq:latest
    environment:
      ACCEPT_EULA: "Y"
    volumes:
      - C:/DockerVolumes/seq/data:/data
    ports:
      - "5341:80"
The data ingested by Seq is stored on my local hard drive (C:\DockerVolumes\seq\data) so it will persist if you shut down the container. You can access Seq in your web browser: http://localhost:5341
Getting Started
To start using OpenTelemetry, you will need to add two NuGet packages to your application:
dotnet add package OpenTelemetry.Extensions.Hosting
dotnet add package OpenTelemetry.Exporter.OpenTelemetryProtocol
In my case, I have two projects (Ambition.UI and Ambition.Accounting) that I want to record telemetry data from, so I’ll need to add these to both projects (The source code is accessible here: https://github.com/edgamat/Ambition)
You configure OpenTelemetry by registering the services in host builder. Here is what I used for the Ambition.UI ASP.NET project:
// Global settings
builder.Services.AddOpenTelemetry()
    .ConfigureResource(resourceBuilder =>
    {
        resourceBuilder.AddService(builder.Environment.ApplicationName);
    });

// Logging
builder.Logging.AddOpenTelemetry(logging =>
{
    logging.IncludeFormattedMessage = true;
    logging.IncludeScopes = true;

    logging.AddOtlpExporter(configure =>
    {
        configure.Endpoint = new Uri("http://localhost:5341/ingest/otlp/v1/logs");
        configure.Protocol = OtlpExportProtocol.HttpProtobuf;
        configure.Headers = "X-Seq-ApiKey=XXXXXXXXXXXXXXX";
    });
});

// Tracing
builder.Services.AddOpenTelemetry()
    .WithTracing(tracing =>
    {
        if (builder.Environment.IsDevelopment())
        {
            // We want to view all traces in development
            tracing.SetSampler(new AlwaysOnSampler());
        }

        tracing.AddOtlpExporter(exporter =>
        {
            exporter.Endpoint = new Uri("http://localhost:5341/ingest/otlp/v1/traces");
            exporter.Protocol = OtlpExportProtocol.HttpProtobuf;
            exporter.Headers = "X-Seq-ApiKey=XXXXXXXXXXXXXXX";
        });
    });
As you can see, Seq uses separate ingest endpoints, one for logs and one for traces:
/ingest/otlp/v1/logs
/ingest/otlp/v1/traces
Please refer to the Seq documentation for the steps to generate an API Key: https://docs.datalust.co/docs/api-keys
The ‘Global Settings’ section is where you can configure settings that will apply to both logs and traces. In this case, we are configuring the service name (Ambition.UI), but you can also add other details, such as the assembly version, the environment (DEV/TEST/PROD), and the host (machine) name, to name a few.
For logging, there are 2 settings (IncludeScopes and IncludeFormattedMessage) we enable in order to include additional information in the logs. The AddOtlpExporter method configures where the logs will be exported to. I use the endpoint described in the Seq OpenTelemetry documentation: https://docs.datalust.co/docs/opentelemetry-net-sdk
The configuration for tracing is very similar. OpenTelemetry provides a means to sample traces to reduce the volume of data exported. For our purposes we want to see all traces and set the sampler to always be on.
The setup for the Ambition.Accounting console application is exactly the same. They will be different once we start including instrumentation, but for now, the same settings work for both console applications and web applications.
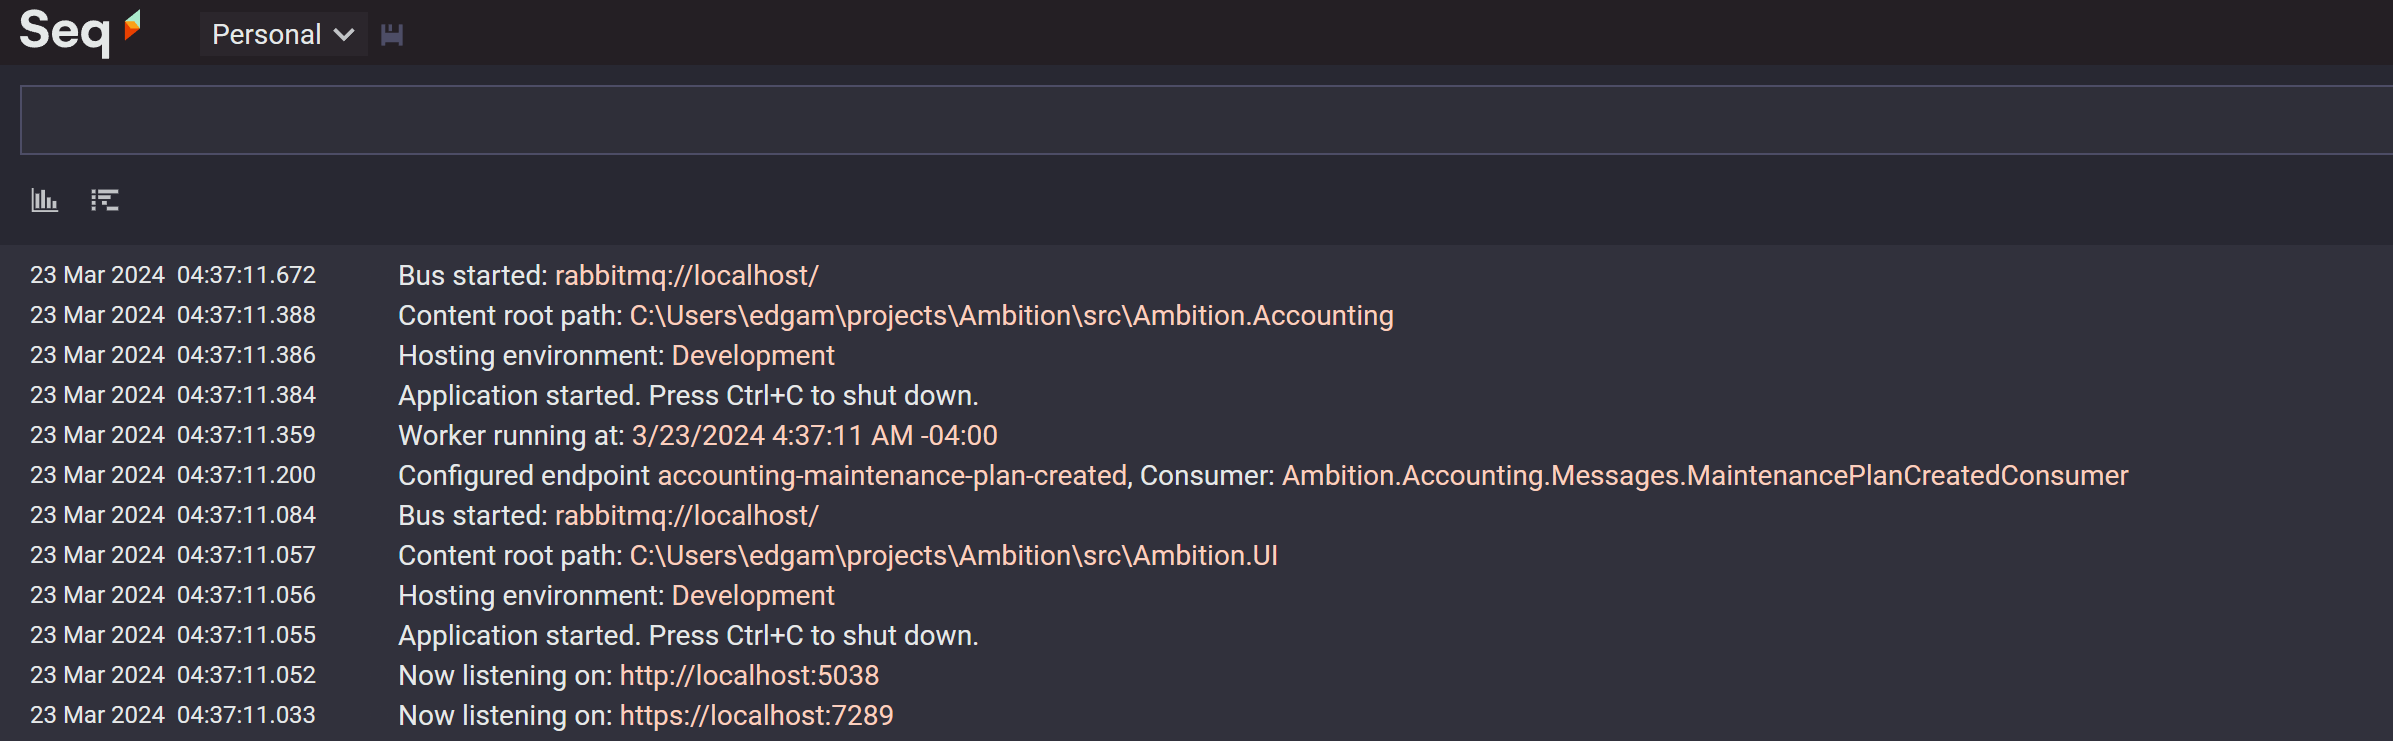
Running the application sends the logs to Seq:
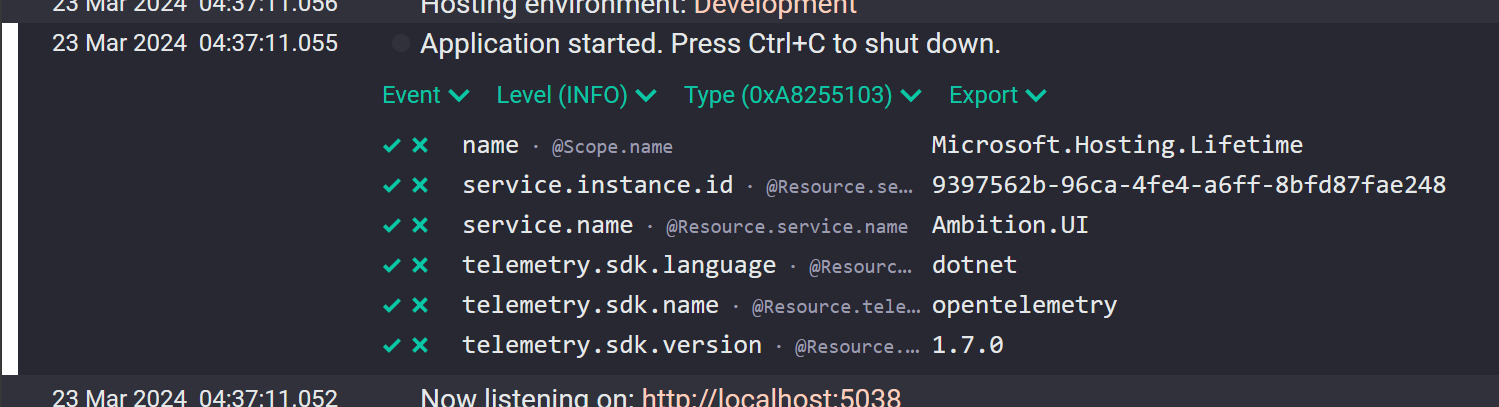
If you expand one of the log entries you can see the attributes included with the log entry:
Enabling Distributed Tracing
So far we are only creating log entries. To include trace spans we need to make some addition configuration changes.
In the Ambition.UI project, we want to generate traces for 3 components:
- ASP.NET requests
- SQL Server queries
- Publishing message using MassTransit
Let’s start by adding two additional packages:
dotnet add package OpenTelemetry.Instrumentation.AspNetCore
dotnet add package OpenTelemetry.Instrumentation.SqlClient --prerelease
(At the time this writing, the SqlClient package is still in prerelease)
In the tracing configuration, we will add the following:
tracing.AddSource(MassTransit.Logging.DiagnosticHeaders.DefaultListenerName);

tracing.AddAspNetCoreInstrumentation()
    .AddSqlClientInstrumentation(options =>
    {
        options.SetDbStatementForText = true;
        options.SetDbStatementForStoredProcedure = true;
    });

tracing.AddOtlpExporter(exporter =>
...
In the Ambition.Accounting project, we want to generate traces for these 3 components:
- SQL Server queries
- Consuming message using MassTransit
- HTTP Requests/Responses
For this project, we need two additional packages:
dotnet add package OpenTelemetry.Instrumentation.Http
dotnet add package OpenTelemetry.Instrumentation.SqlClient --prerelease
In the tracing configuration, we will add the following:
tracing.AddSource(MassTransit.Logging.DiagnosticHeaders.DefaultListenerName);

tracing.AddHttpClientInstrumentation()
    .AddSqlClientInstrumentation(options =>
    {
        options.SetDbStatementForText = true;
        options.SetDbStatementForStoredProcedure = true;
    });

tracing.AddOtlpExporter(exporter =>
...
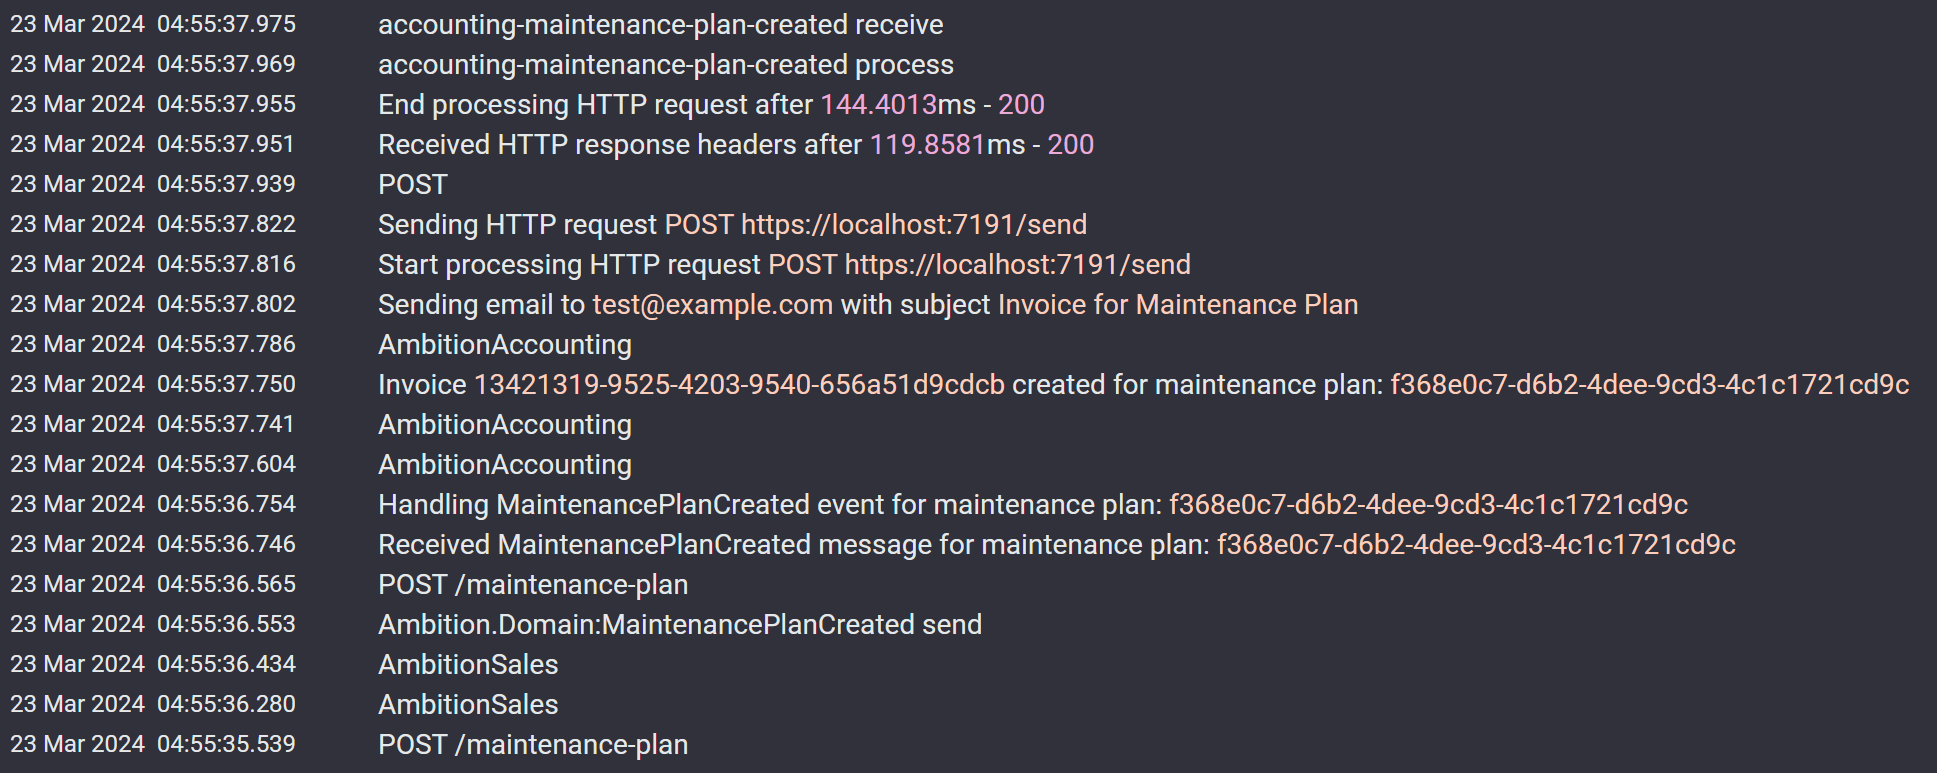
When we create a maintenance plan, we see the logs, and we also see some additional entries:
These additional entries are the trace spans. If we expand one of them we see the following:
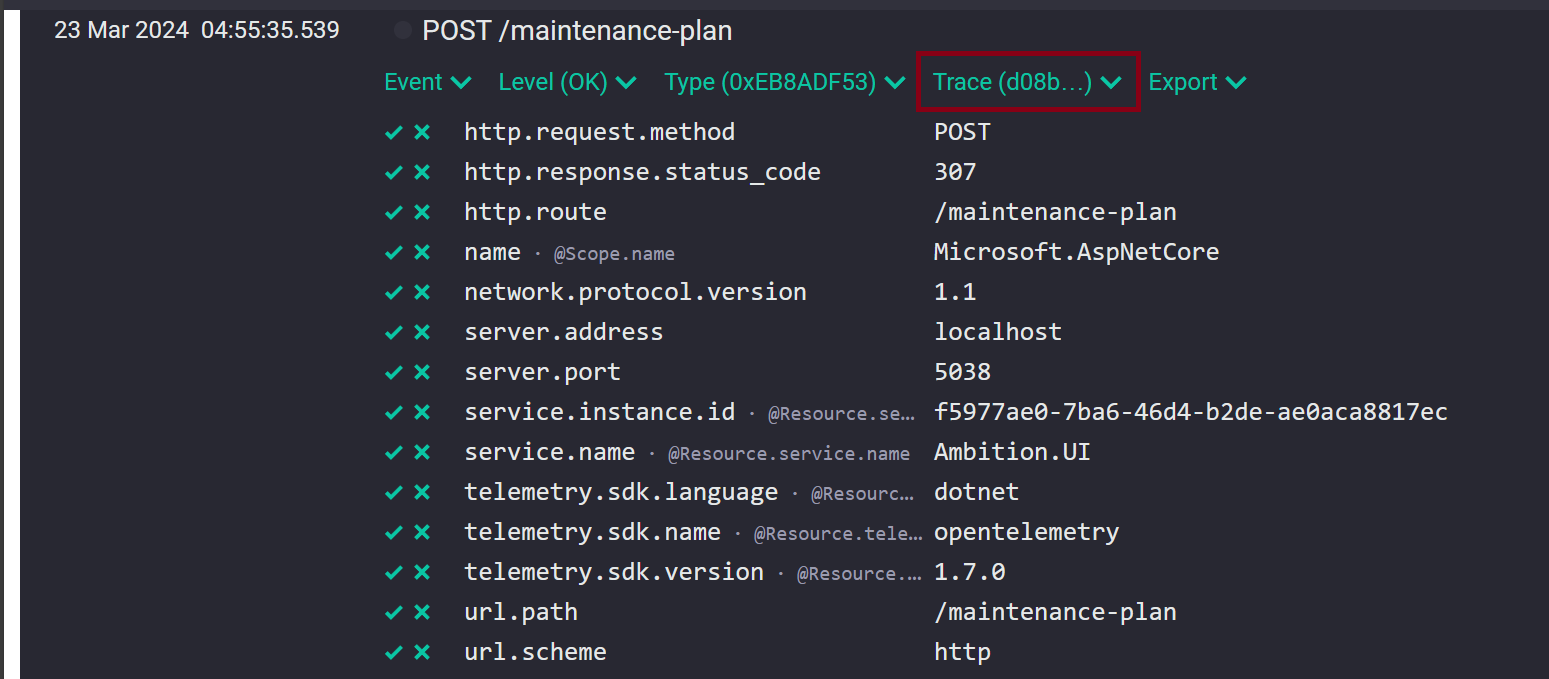
We can see the additional attributes added by the instrumentation, as well as a new trace id ("Trace (d8b...)). This trace id links all of these span and log entries together. If you filter by the trace id in Seq, you can look at all of the entries for a single trace:
@TraceId = 'd08b79d2c607cc385362a9dd56eba10b':
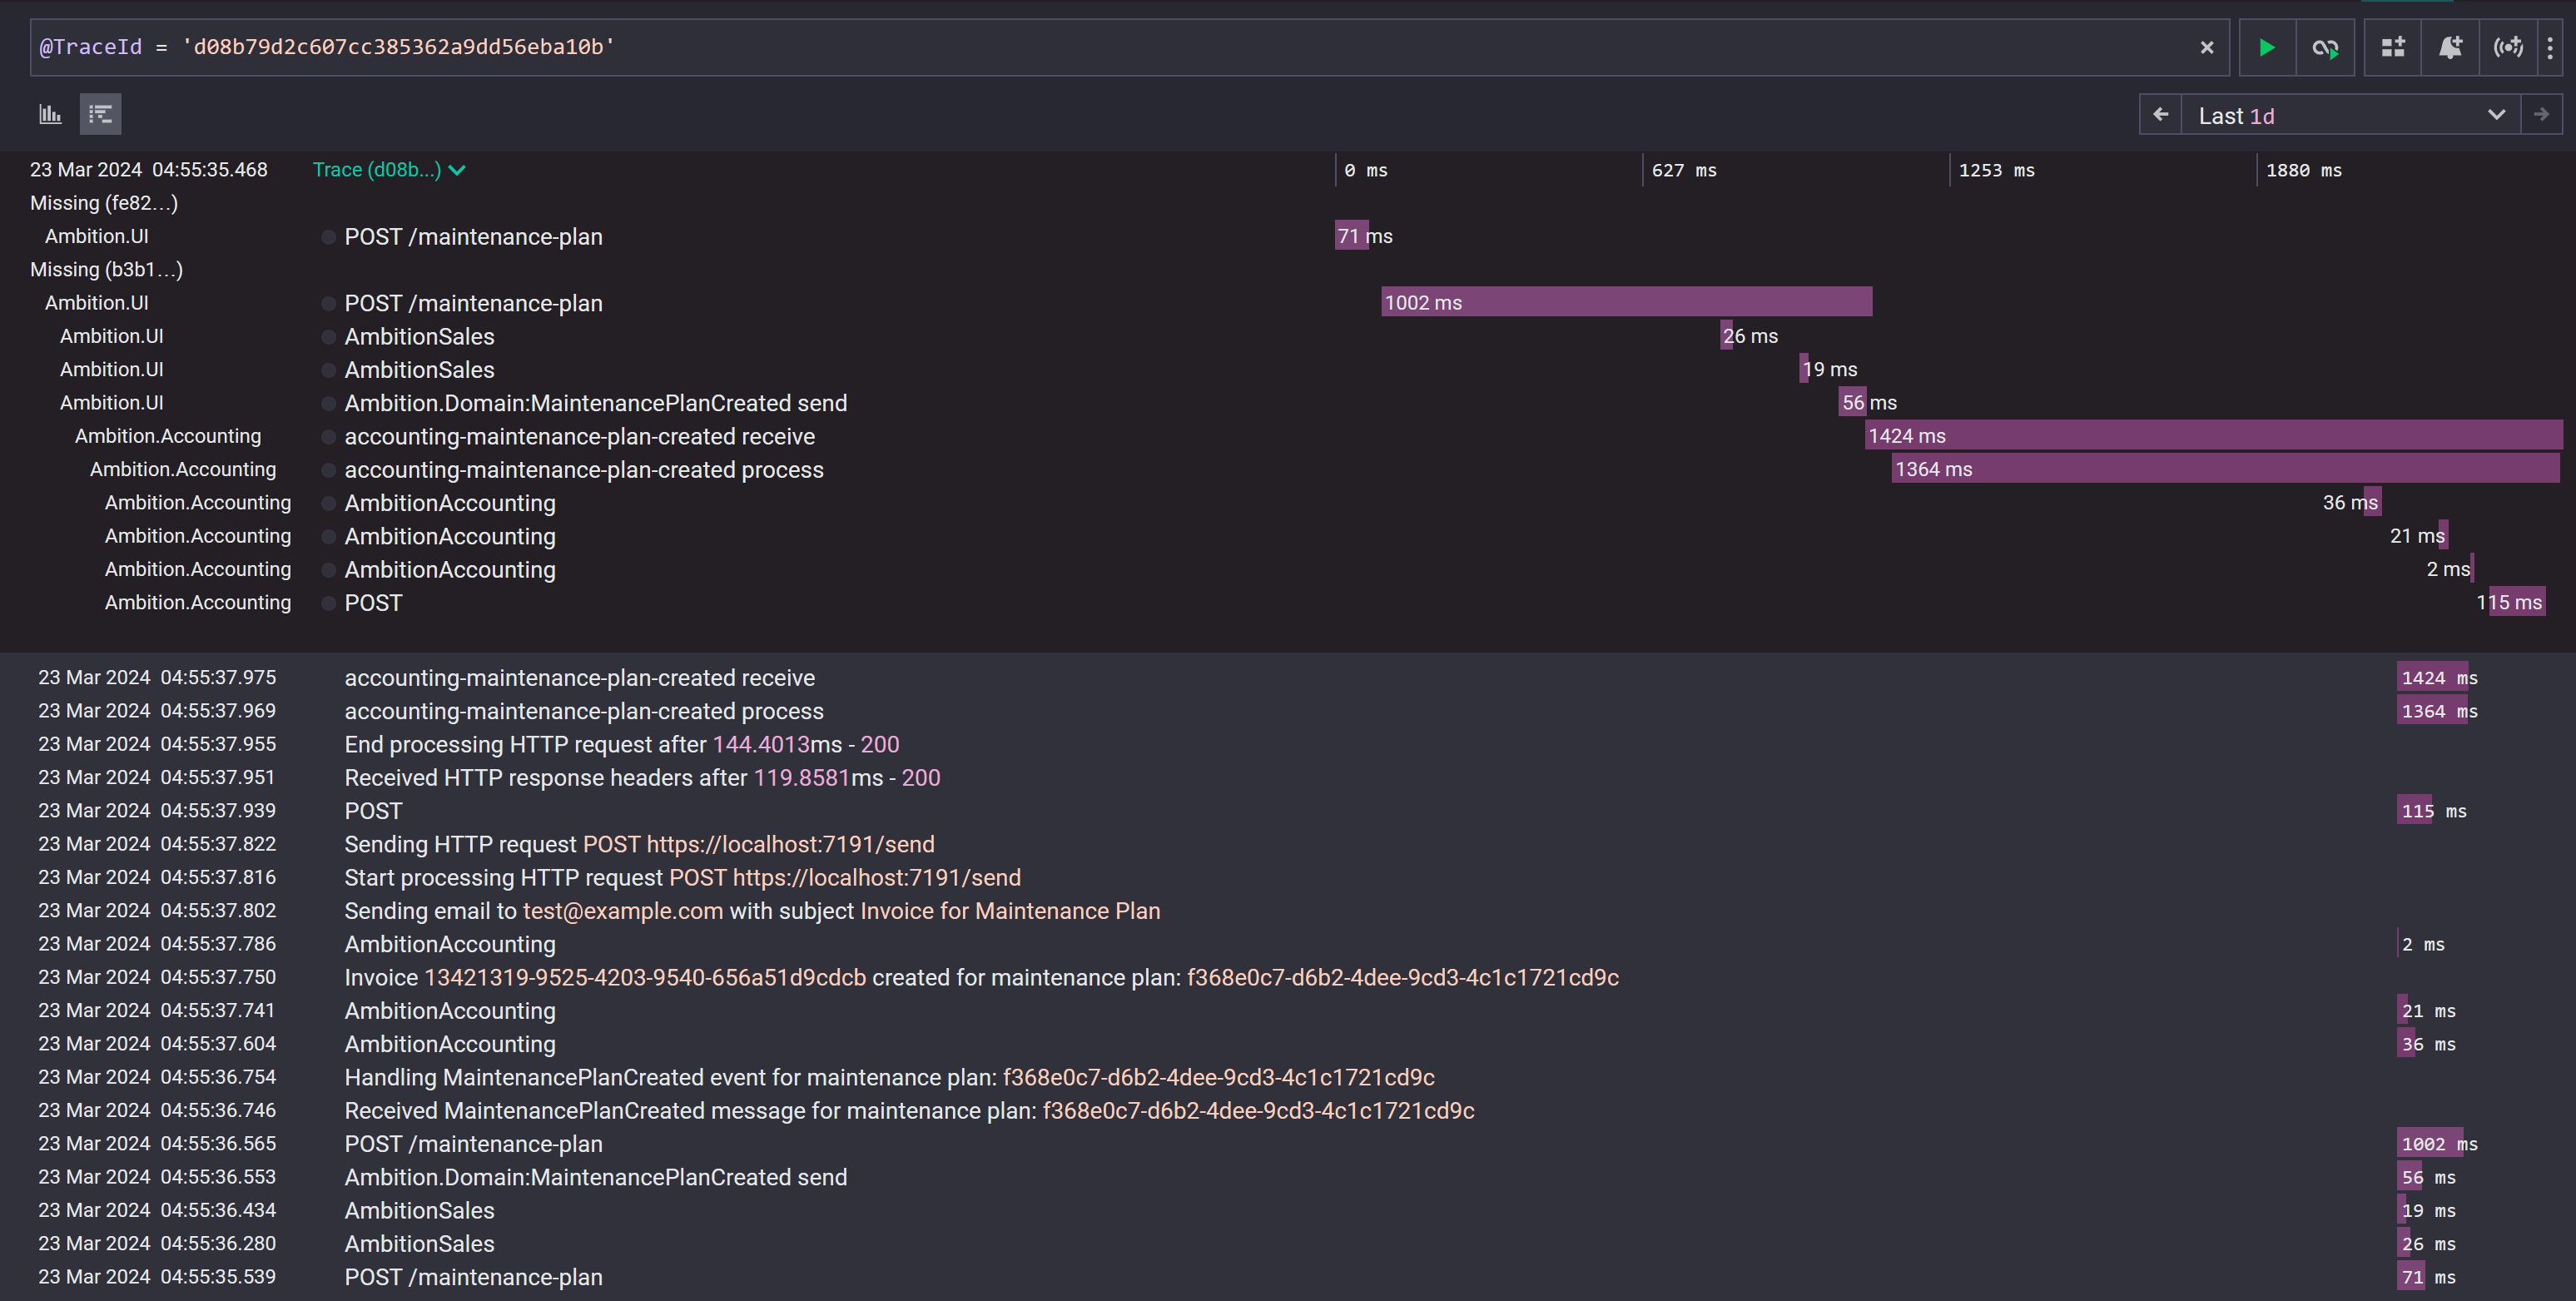
You can see that all the activity is linked together:
- All the log entries,
- The POST to the /maintenance-plan endpoint to create the plan,
- The database queries to save the data,
- Publishing the message from the UI project
- Consuming the message in the Accounting project,
- Saving the invoice in the database, and
- Sending an HTTP request to the Mercury.Email service
Summary
OpenTelemetry allows us to export logs and traces to a log analysis tool, without having to use any vendor-specific protocols. The .NET ecosystem provides a rich set of instrumentation automatically enabling enhanced logging and distributed tracing.
In the next part in this series, Let’s see what happens when exceptions and errors occur.